Learn about bond returns and risks. Read this with the step-by-step guide to build an all weather portfolio with stocks, CDs, bonds, and bond funds. The allocation to bonds controls the overall portfolio risk and provides the stability to stay the course across the inevitable turbulent market periods.
You will be tempted towards higher bond returns. Learn about the risks.
Nearly all the risk from owning bonds is driven by two factors: the time to maturity and the credit quality of the issuer. This chapter explores these two, plus mentions others to be aware of, so you can understand what bond investments are appropriate for your portfolio.
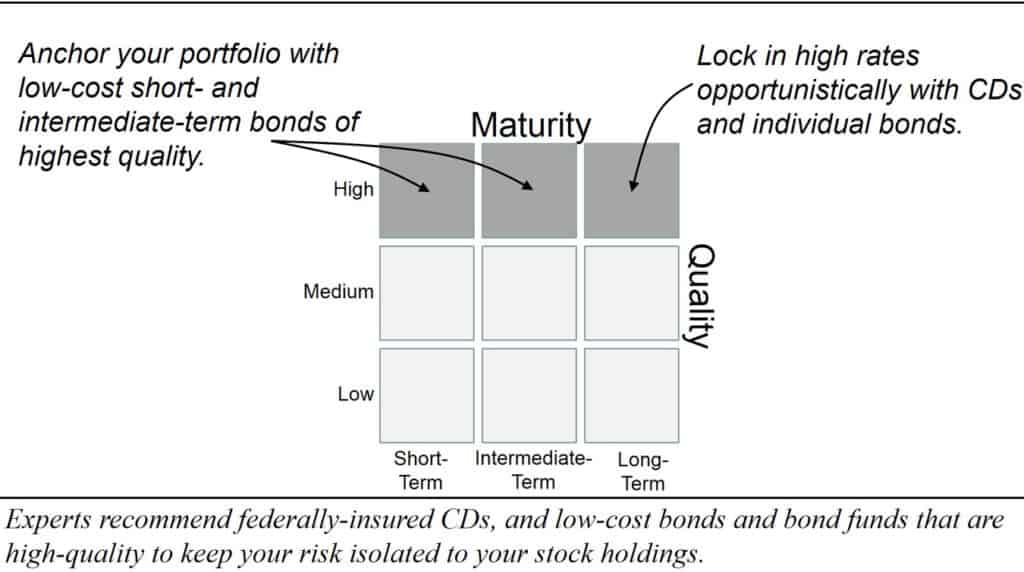
A simple map of investment possibilities might look like this 9-box style guide. For most investors, the role of bonds is to add safety and anchor your portfolio during falling stock markets (“bear” markets), allowing you to stay disciplined. We will discuss why short- and intermediate-term low-cost bond funds comprised of the highest grade bonds satisfy your needs. There are also times when locking in high interest rates with longer-term CD, individual bonds, or especially TIPS can be valuable. And just as important: why you should avoid lower-quality bonds and more expensive actively-managed bond funds.
Yield, Price And Making Comparisons
KEY CONCEPTS:
- Yield-To-Maturity (YTM) is the best way to compare individual bonds.
- 30-day SEC Yield is best way to compare bond funds.
- Total return is the best way to measure and compare the performance of any investments, of any types.
This chapter will clarify the key metrics to compare bonds and bond funds, the importance of total return for measuring performance, the usefulness of duration for controlling interest rate risk, and some practical insights we can infer about the market’s expectations for the future as revealed by current pricing (yield curves).
How To Compare Individual Bond Returns
The word yield is used in multiple descriptive phrases but three are the most important: coupon yield, current yield and yield to maturity. Each has a very precise meaning. Let’s look at each.
Coupon yield is set when a bond is issued. It is the interest rate paid by the bond, and it is listed as a percentage of par, or face value, which is the principal amount that will be paid at maturity.
The coupon yield designates a fixed dollar amount that never changes through the life of the bond. If a $1,000 par value bond is described as having a 10% coupon, that coupon will always be $100 for each bond, paid out in $50 increments every six month for the entire life of the bond—no matter what happens to the price of the bond, or to interest rates. That is the reason bonds are called fixed-income securities.
Current yield. Almost as soon as a bond starts trading in the secondary market, it ceases to trade at par. A bond’s current yield is its annual coupon divided by its market price.
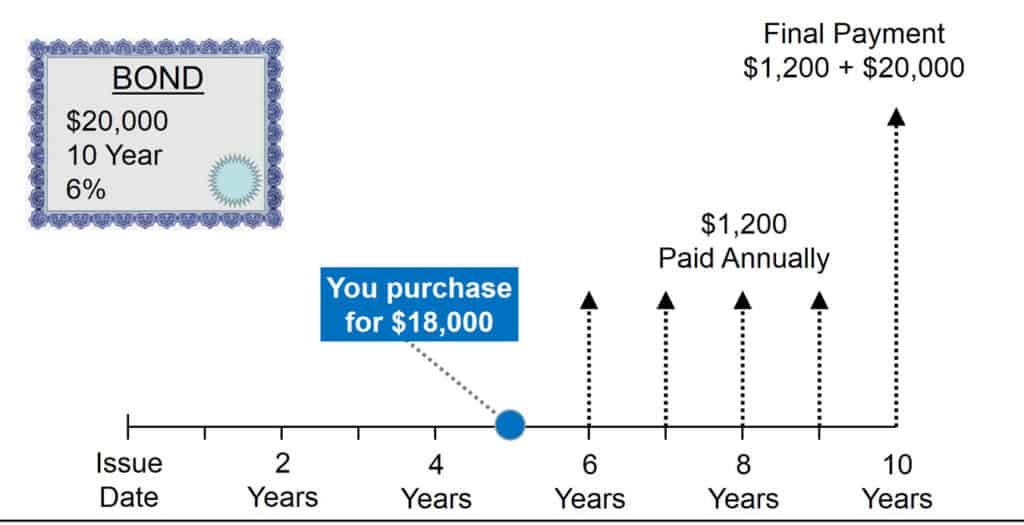
Example: Say a bond has a face value of $20,000 and makes annual interest payments of $1,200. You buy it at 90, meaning that you pay 90% of the face value, or $18,000. It is five years from maturity. The bond’s current yield is 6.7%:
($1,200 annual interest / $18,000 x 100) = 6.7%
While current yield is easy to calculate, it is not as accurate a measure as yield to maturity. See in the next example why the yield to maturity for this same bond is 8.54%.
Yield to Maturity, sometimes called the bond’s yield for short.
You can see from the above description that current yield is based only on the coupon and the current market price. Current yield fails to measure two important sources of income that investors earn from bonds: compound interest—from reinvesting (not spending) the coupon payments—and changes in the bond price.
Yield to maturity (YTM) is a more comprehensive measure of potential return than “current yield” and it is the most valuable measure for comparing individual bonds. It estimates the total amount that a bond will earn over the entire life of an individual bond, from all possible sources of income—coupon income, interest-on-interest, and capital gains or losses due to the difference between the price paid when the bond was purchased and par, the return of principal at maturity. The next example and picture will illustrate this.
Example: In the previous example we calculated that bond’s current yield is 6.7%. But the bond’s yield to maturity in this case is higher. It considers that you can achieve compounding interest by reinvesting the $1,200 you receive each year. It also considers that when the bond matures, you will receive $20,000, which is $2,000 more than what you paid. The next picture shows that each future payment is discounted to what it is worth today. The YTM is 8.54%, or the discount rate such that the values of all future payments sum to the current market price.
Pricing The Bond With Yield of 8.54%
In this example, the market establishes the yield for 5-year maturities (the amount remaining on our 10-year bond) at 8.54%. Each future coupon is discounted by dividing by (1+YTM) for each year. We can see that the current bond price is exactly the present value of future coupons and return of face value at maturity:
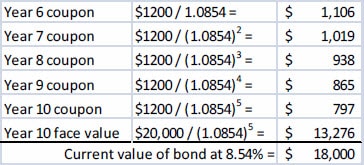
The yield to maturity will give you an estimate of the total return of the bond, assuming the bond is held to maturity and all coupons are reinvested at a rate equal to the yield to maturity.
Key Point: The chief usefulness of YTM quotes is that they allow you to compare different kinds of bonds—those with dissimilar coupons, different market prices relative to par (for instance, bonds selling at premiums or discounts), and different maturities.
How to Compare Bond Fund Returns
Unlike individual bonds, since there is no single date at which the entire portfolio of a bond fund matures, bond funds cannot quote a YTM equivalent to that of individual bonds.
Indeed, most bond funds maintain what is known as a constant maturity. That means, for example, that if a bond fund invests in long-term bonds, then bonds are bought and sold continually to maintain a portfolio long-term maturity of ten years or greater.
SEC Yield. Yield of a bond fund measures the income received from the underlying bonds held by the fund. The 30-day annualized yield is a standard formula for all bond funds based on the yields of the bonds in the bond fund, averaged over the past 30 days. This figure shows you the yield characteristics of the fund’s investments at the end of the 30-day period. It does not indicate the fund’s future yield. The 30-day yield also helps you compare bond funds from different companies on a standard basis.
The chief value of the 30-day SEC Yield is to compare various types of bond funds. Think of the SEC yield as the average YTM of the fund for a recent 30-day period.
The price of a bond fund changes continually in response to changes in interest rates—exactly as with individual bonds (because that’s what it’s a collection of!). As a result, the price of any bond fund at any future date is impossible to predict, but it doesn’t vary any differently than the individual bonds of which it is comprised.
Returns posted by bond funds for prior periods, and listed in daily newspapers, are total returns. They always include changes in the price of the bond fund due to changes in interest rates. This is always the best way to measure and compare past performance of any bonds or bond funds. In the next chapter we will learn how to use duration to reduce risk from changing interest rates.
Don’t be tempted to compare funds based on other numbers that might look attractive. For instance, Distribution Yields, which are sometimes computed from the prior year’s distributions. These are particularly misleading because they reflect interest rate changes and capital distributions. Instead use Yield-To-Maturity to compare individual bonds, use 30-day SEC Yield to compare bond funds, or use total return to compare anything with anything.
Total Return—To Measure And Compare Performance
Total return. A bond fund’s total return measures its overall gain or loss over a specific period of time. Total return includes income generated by the underlying bonds and (both realized and unrealized) price gains or losses. Investors should focus on total return when evaluating performance of bond funds.
Investors in fixed-income securities sometimes make the mistake of equating interest income or advertised yield with return. But this does not take into consideration what is happening to principal.
Total return for bonds consists of whatever you earn in interest income, plus or minus changes in the value of principal. (To be totally accurate, you would also subtract taxes and commission expenses from return.)
Example: Let’s assume that a year ago, you invested $10,000 in a bond fund, purchasing 1,000 shares at $10.00 each. Assume also that the bond fund was advertising a yield of 10%, or $1.00 per share, which was maintained for the entire year. But suppose that in the meantime, interest rates have risen so that now bond funds with similar maturity and credit quality yield 11%. As a result, your bond fund is now selling for $9.00 per share. What is the total return on that investment for the past year?
You have earned interest income (based on the monthly coupon distributions) of 10%, or $1,000. But, that ignores the fact that your bond fund has now lost approximately $1 per share (10% of its principal value) and that your principal is now worth $9,000.
Add the income earnings of $1,000 to the current value of your fund ($9,000). Your investment is now worth $10,000. (For the sake of simplicity, I am ignoring interest-on-interest and commission costs.) Therefore, the net return is $0, or 0%. That is your total return, to date, even though you have received 10% interest income.
If instead interest rates had declined to 9%, the price of your bond fund would have risen to $11,000, and your capital gains would have added to the interest income your fund distributed, and your total return would have risen to 20%:
($1,000 interest + $1,000 price increase)/$10,000 = 20%
The concept of total return applies equally to individual stocks and bonds and to funds of every kind.
Total return is ultimately what we care about—and we want this to be larger than inflation. And the beauty is that it gives us a way to compare any of your investments with any others.
For both stock and bond funds, total return over time is conveniently depicted by a chart that is called Growth of Hypothetical $10,000. This is the fair way to compare funds comprised of different types of assets.
Example: Comparing Total Returns
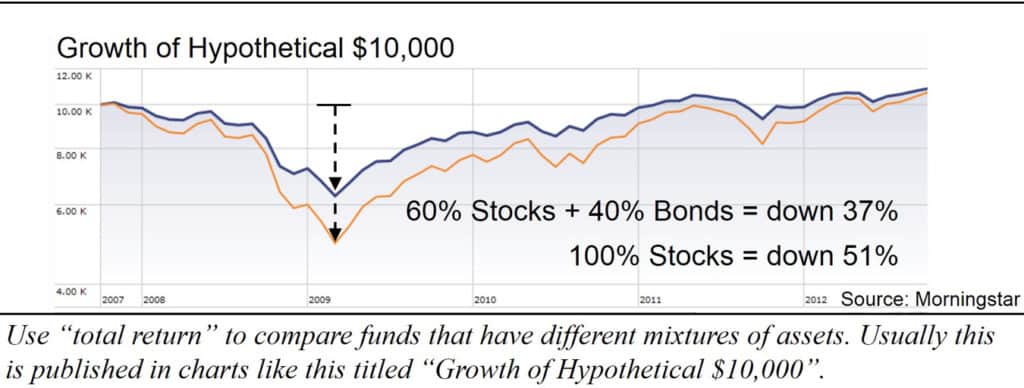
Suppose you wanted to consider how two portfolios with different asset allocations fared over the great recession in 2008-2010. You would do this by comparing total returns, which is most easily accessed in charts titled Growth of Hypothetical $10,000. The 100% stock portfolio lost more than 51% from its peak in 2007 whereas the 60/40 portfolio lost 37% over the same period. If withdrawals were required and recovery took a decade, the safety in the balanced portfolio is apparent. As it turned out, the stock market rebounded relatively quickly this time and so long-term stock investors escaped scot-free this time—except for those that panicked and abandoned their plans. Remember, a very important reason to own a balanced portfolio is to give you the emotional fortitude to “Stay the Course”.
Remember, when comparing bond funds, look at total return (also called Growth of $10,000) and the 30-day SEC Yield.
High-quality bond investors have fared well 2008-2012, both because interest rates dropped as the Federal Reserve tried to stimulate the economy and from a flight to quality that accompanied the uncertainty. But since interest rates can change in both directions it is important that we learn how to reduce risk from interest rate changes for when we need to.
How To Reduce Risk From Interest Rate Changes
KEY CONCEPTS:
- Duration is an essential attribute for understanding the riskiness of a bond fund or ladder over time.
- The duration of a bond, or a bond fund, is a measure of its price sensitivity to interest rate changes.
- Investors are indifferent to interest-rate changes if they hold their bond (or bond fund) for the length of time called duration after interest rates change.
- Individual bonds have declining duration. (This is useful.)
- Bond funds have constant duration. (This is also useful.)
We’ve learned that all bonds and bond funds are subject to interest rate risk—that is: if rates go up, the bond prices instantly go down, preserving the time value of money.
Bond maturity provides a rough indication of ‘riskiness’. All other things being equal, the longer the time period to maturity for each bond, the greater the volatility of its price. However, this measure only takes into account the final payment (not any other cash flows), does not take into account the time value of money and therefore does not give an accurate comparison of relative ‘riskiness’ across bonds.
Heads-up! I’m going to teach you a new word. It’s valuable, useful, and worth knowing. But, you are going to trip because your brain already thinks it knows this word. It will help if every time I write duration, you mentally replace it with the words “financial duration”. Then you’ll remember it is special, and you’ll be fine.
Duration is a better factor to characterize risk than time to maturity. It’s a more sophisticated measure as it takes into account all cash flows and time value of money. It tells how long you’d have to hold a bond or bond fund after an interest rate change to be indifferent to such changes. After demonstrating this, you’ll learn how to use duration to compare riskiness across bonds and estimate the impact of an interest rate change.
Duration: The Point of Indifference to Interest Rates
The first valuable way that the duration of a bond or bond fund can be applied is to reduce interest rate risk by matching duration to the point in time of specific liabilities. I’ll walk you through this. William J. Bernstein offers a valuable definition:
Duration is the point at which you become indifferent to changes in price and yield.
Mr. Bernstein provides this example to illustrate the first important concept of finding the point in the future where you become indifferent to an interest rate change today. Consider a one-year Treasury bill. A bill is in reality a zero coupon bond. It is bought at a discount with no interest payments before maturity. For example, a 5% bill will sell for $0.9524 ($1.00/1.05) and be redeemed at par ($1.00). If someone purchases this 5% bill, and a few seconds after it is issued yields suddenly rise to 10%, it falls in price to $0.9091 ($1.00/1.10), with an immediate loss of 4.55%.
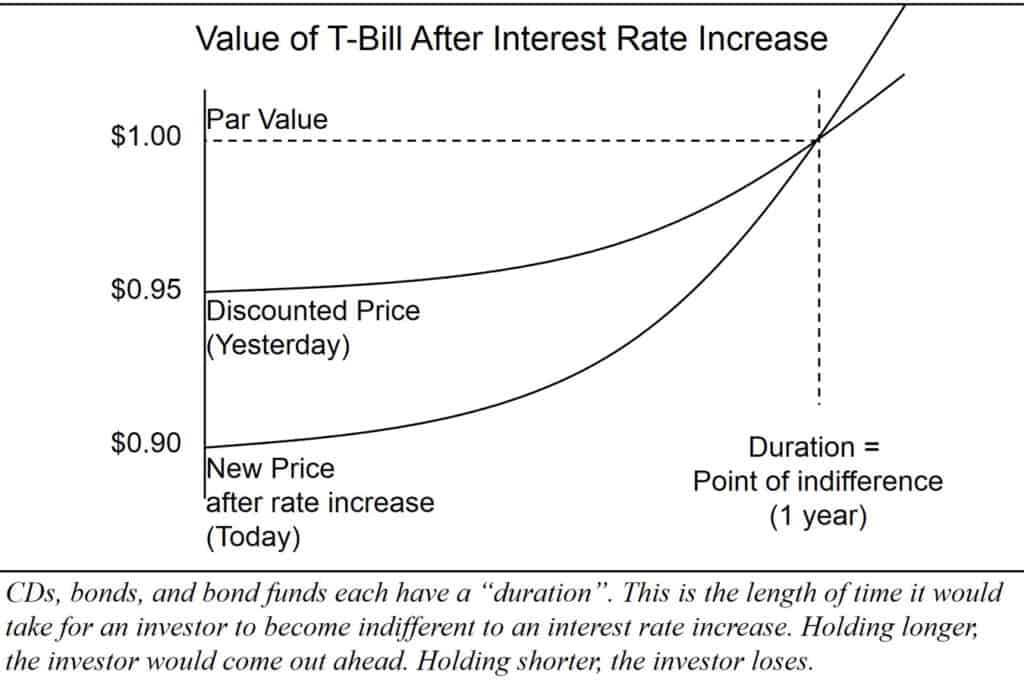
But, if our investor holds the bill to maturity, he will receive the full 5% return, the same as if there had been no yield rise/price fall. And beyond the one year maturity, it’s all gravy—our investor can now reinvest the entire proceeds at double the yield. His “point of indifference” is thus the one-year maturity of the bill; before one year he is worse off because of the yield rise/price fall, and after one year he is better off.
The formula for bond duration is complex, but the most important thing to remember is that the bigger the coupon or yield, the larger the gap between duration and maturity—at 10% yields a bond with 10 years maturity will have a much shorter duration than at a yield of 5%. And finally, for a zero-coupon bond, maturity and duration are the same.
Duration tells us how long we must wait to become indifferent to an interest-rate change. The following two sidebars will help you get an intuitive grasp of how this important concept of duration is related to coupons and maturity. The way these interact with each other becomes apparent if you were to consider balancing them on a teeter-totter.
Duration of a Zero Coupon Bond is equal to its time to maturity.
Duration of a Zero Coupon Bond is equal to it time to maturity.

The lever above represents the five-year time period it takes for this zero-coupon bond to mature. The money balancing on the far right represents the present value of the amount that will be paid to the bondholder at maturity. The fulcrum, or the point balancing the lever, represents duration, which must be positioned where the lever is balanced. The fulcrum balances the lever at the point on the time line at which 50% of the cash flows (on a net present value basis) will have been returned. The entire cash flow of a zero-coupon bond occurs at maturity, so the fulcrum is located directly below this one payment.
This extreme case, where the coupons are $0.00, shows that small coupons don’t have much effect on making duration less than the time to maturity. Next, we see that bigger interest payments do.
Duration of a Simple Coupon Bond is always less than its time to maturity.
Consider a simple bond that pays coupons annually and matures in ten years. Its cash flows consist of ten annual coupon payments and the last payment includes the face value of the bond.

The money represents the present value of all cash flows you will receive over the ten-year period. Their sum equals the amount paid for the bond. The fulcrum balances the lever at the point on the time line at which 50% of the cash flows (on a net present value basis) will have been returned. The picture above shows the duration of this bond is 7.5 years.
As coupons are distributed and the present value of remaining cash flows are recalculated, the timeline to bond maturity gets shorter and the fulcrum shifts to the right. CDs and individual bonds all have declining duration as time approaches the bond maturity.
This picture provides an intuitive way to grasp why the coupon payments don’t do much to shorten the duration when the bond gets close to maturity.
Regular coupon bonds make coupon payments throughout its life, as do a collection of bonds—be they in a bond ladder or in a huge fund. Very often the term average duration is specified to characterize the entire collection. The point of indifference to interest rate changes applies identically for a fund as for individual bonds. A characteristic of funds is that they are often managed to maintain a collection of bonds that produce a rather stable, or constant, average duration.
Key Point: Individual bonds have declining duration that ultimately becomes zero when the bond matures.
A zero-coupon bond automatically reduces duration by exactly the amount of time that passes, and is therefore the risk-less choice for meeting a future obligation. A coupon-paying bond approximates this: duration declines very slowly at first and then more rapidly once the bond nears its maturity; this is more pronounced when interest rates are high and less important when rates are low.
A bond fund duration is relatively constant. For most purposes, it is easy to gradually shift from intermediate- or longer-term bonds to shorter-term bonds as the need for capital approaches, which will reduce sensitivity to interest-rate changes.
Duration: The Measure of Sensitivity to Interest Rates
To be absolutely assured of receiving a given sum on a future date, your goal is to gradually reduce the sensitivity to interest rate increases as the date approaches. The financial term “duration” is also a measure of this sensitivity. The significance of a declining duration is the declining sensitivity to interest rate changes.
The second valuable application of duration is for a quick estimate of just how much the price of a bond or bond fund would immediately change after a small change in interest rates. I’ll call it a rule-of-thumb to give it an appropriate context.
Bond Price Change (%) = – (interest rate change in %) x duration
An example mentioned earlier is that a bond with a 5-year duration will decrease 5% in price with each 1% increase in yield. The same would be true for an intermediate-term bond fund that has a 5-year duration.
Limitations: If you use this as a rule-of-thumb to help you make comparisons you will be making good decisions. If you are expecting precision, you’ll be disappointed.
For one reason, this second application of duration uses a slightly different definition for duration. Secondly, this modified definition is only valid for small changes in interest rates. Historically, rate changes have been rather gradual—so that hasn’t been a problem.
Lastly, it’s not entirely clear how each fund computes duration. For instance, both Fidelity and Vanguard call it ‘Average Duration’, but to define it Fidelity seems to use the time-weighted definition and Vanguard seems to use the ratio definition. In truth, they may both use something different to handle the bonds that have special features like call provisions. My advice: use it then move on! Use it as a rough metric to make good decisions and then move on with your life. Duration is a valuable tool! But if you are using it to manage a corporate pension fund then you would be reading an advanced book.
The earlier example where a hapless investor experienced the one-time instantaneous 5% interest-rate increase was useful to illustrate important point that you can be indifferent to interest rate if you hold the bond for the duration and reinvest the dividends at the new rates. Past history suggests that rates change at a much more gradual rate. This next side bar shows interest rates gradually increasing over 4% over a two year period, and the total returns of all bonds continued to grow.
Example: The Federal Reserve influences interest rates by controlling the very short-term Federal Funds rate. Changes are very gradual. For example they increased from 1% to 5.2% at a steady gradual pace over two years (mid-2004 to mid-2006). Yes, the bond prices responded exactly as I have described—bond pricing is mostly simple math, not emotions or projections—but the loss in bond values from rising rates simply made the total returns less positive. The following chart shows the total return of $10,000 invested in short-, intermediate-, and long-term U.S. Treasury bond index funds—continuing to grow, just slower:

Another important lesson from history is that nobody can predict interest rates. There are currently a lot of people that think rates are so low that there is nowhere to move but up. They have thought this for six years now. And if they have stayed in short-term bonds because of this reasoning they have already lost several years of the higher yields from, say, intermediate-term bonds. Nobody knows how low this, or any, interest rate environment will last. But you can become indifferent to changes! Hold short or intermediate-term high-quality bonds based on when you need the money—avoid speculating on future interest rate changes.
Since we are investors, not speculators (gamblers), we also don’t want to gamble on future rates of inflation. You cannot predict this! Nobody can. But we can own bonds in a way that protects us if inflation is higher than expected, and also if inflation is lower than expected.
